Recognition
Cavisson Systems continues to lead the way, earning accolades as a key player in transformative digital performance technologies.
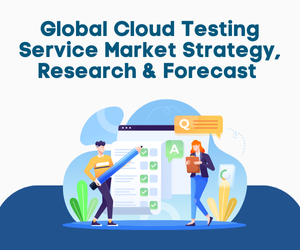
Our cloud testing capabilities have been recognized for helping businesses ensure the performance, scalability, and reliability of their applications in cloud environments, as highlighted in this comprehensive market forecast. Read more…
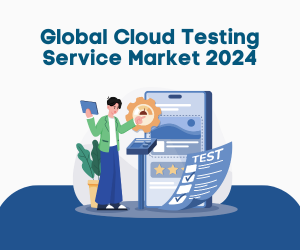
Cavisson Systems has once again been named a key player in cloud testing by Orbis Research, emphasizing our ability to deliver robust performance testing and monitoring solutions that support digital transformation across industries. Read more…
Our advanced chaos engineering tools have been recognized by Research and Markets for their role in helping organizations proactively identify and address system vulnerabilities, ensuring high availability and reliability. Read more…

Cavisson Systems has been acknowledged as a leading player in the Global Web Performance Monitoring Tool Market by Orbis Research. This recognition highlights our advanced monitoring solutions that help businesses ensure seamless digital experiences through real-time performance tracking and optimization. Read more…
Recognized for our innovative chaos engineering platform, Cavisson’s solutions empower SREs and DevOps teams to simulate real-world failures and build more resilient systems, solidifying our position as a key player in the evolving chaos engineering landscape. Read more…
Cavisson Systems has been featured in the HTF MI study for our leadership in service virtualization, enabling development and QA teams to simulate backend services and reduce dependencies for faster and more reliable software testing. Read more…
Featured in Market Research Forecast’s report, Cavisson Systems is acknowledged for its long-term strategic impact in performance engineering, driving innovation in digital experience and system resilience. Read more…
Our contributions to chaos engineering have been highlighted by Stats N Data, recognizing Cavisson Systems as a key provider of tools that help businesses test system resilience and ensure operational continuity. Read more…
Cavisson Systems is recognized for its leadership in web performance solutions, enabling organizations to deliver seamless and responsive digital experiences across diverse platforms and geographies. Read more…
Partnership
Provide a high-level overview of recent events or activities impacting the organization or community.
Strategic partnership 🤝 with Netpoleon
Cavisson Systems x Netpoleon
We’re excited to announce our strategic partnership with Netpoleon as our value-added distributor. This collaboration enables us to expand our reach by leveraging Netpoleon’s extensive network of trusted channel partners across key markets. Together, we’re committed to delivering cutting-edge performance testing, observability, and digital experience solutions to organizations worldwide.

Awards
Recognizing Excellence in Performance Testing
Anil Kumar: One of the 10 Best CEOs to Watch in Asia 2024 – Business Fortune
- “From the outset, Cavisson has been at the forefront of innovation in enabling organizations to create resistance to failure.” – Anil Kumar, CEO, Cavisson Systems.
- Business Fortune has recognized Anil Kumar as one of the 10 Best CEOs to Watch in Asia for 2024. This accolade celebrates his visionary leadership and dedication to empowering businesses with resilient, high-performing digital systems.
- Our vision is to continuously evolve our Experience Management Platform to meet the dynamic needs of the digital-first economy and to also focus on our individual product offerings by constantly pushing the innovation gradient.

PRODUCT UPDATES
Explore our latest features designed to optimize digital experiences, boost reliability, and accelerate innovation.
Monitor
Support for SAP ASE Monitoring
Cavisson now supports SAP ASE (formerly Sybase), enabling real-time visibility into transaction activity, cache hit rates, and other critical performance metrics. Identify root causes and resolve costly performance issues across your Sybase ASE servers seamlessly.Support for SAP IQ Monitoring
Expand your SAP monitoring capabilities with support for SAP IQ, a robust relational database server designed for business intelligence and big data analytics. Monitor processes, cache, and requests to optimize performance effectively.Extended Support for SAP HANA
Enhanced metric coverage for SAP HANA includes Backup, Prepared Statements, Services, Components, and Schema data points, making Cavisson one of the most comprehensive tools for SAP HANA monitoring.Support for EMQX
Monitor EMQX, an open-source MQTT broker for IoT applications, ensuring efficient, reliable, and real-time data transmission for IoT setups.Enhanced Network Monitoring via SNMP
Visualize network device availability and performance on a geomap for quick issue identification.
Access SNMP metrics in an intuitive hierarchy within the metric tree for better navigation.
Extended MSSQL Monitoring
Added support for table space monitoring and expanded IO Latency metrics to diagnose and resolve read/write performance issues.
Enhanced Date-Time Picker
Switch between always-on monitoring and test-based time periods for simultaneous LoadTest and Monitoring sessions.
Compare recent data with various time periods for better release impact analysis.
Apply time periods using simple commands (e.g., 5m/5h/5d) and flexible date/time formats.
Updated Tabular View
Unified tables across modules for a consistent user experience. Features include global/column search, error-free sorting, column visibility/reordering, and export options (Word, PDF, Excel, CSV).
Updated Scheduler
Customize schedules for alerts, reports, diagnostics, and Load Tests with intervals ranging from seconds to years. Validate schedules with a preview option for accuracy.
Access Control – Tier-Wise Permission Capability
Admins can now grant tier-specific permissions to users, ensuring data security and integrity.
Widget Enhancements
iFrame Widget Support
Embed HTML pages, such as NS Summary Reports or Test Suite Reports, directly into dashboards for streamlined analysis.Top List Chart Widget Support
Identify entities with the highest or lowest metric values (e.g., CPU usage, disk space) for efficient troubleshooting.Label Widget – Link Support
Add and parameterize links in the label widget for seamless integration with third-party tools.Geo Map Support
Plot metrics on a map based on location data (Country, State, City) or latitude/longitude for precise geographic visualization.E2E Widget Enhancements
View network topology maps to identify problematic devices.
Analyze Business Transaction trends (Response Time, TPS, Errors) to prioritize performance improvements.
Alerts
UI Support for Alert Notifications
Configure Slack, Teams, and Webex notifications directly from the UI. Customize messages for different stakeholders effortlessly.
Reports
Updated Scheduler Support
Leverage the new scheduler’s customization options for precise report generation.Non-Business Hour Support
Pause report generation during non-business hours to reduce unnecessary notifications and data overhead.Dynamic Percentile Support
Customize percentiles in Load Test Summary Reports for a deeper performance analysis.
Load Test Enhancements
Enhanced Root Cause Analysis: Perform flow path drill-down directly from Page Detail Reports to identify bottlenecks during load tests with precision.
Support for MQTT Protocol: Accelerate and streamline IoT communication with added support for the MQTT protocol.
Net Cache Stats: Monitor cache performance effortlessly and reduce server load with our newly introduced Net Cache Stats feature.
Optimized HTTP/2 & HTTP/3: Experience improved application performance with optimized inline request scheduling for HTTP/2 and HTTP/3 protocols.
Selenium Integration with RBU: Simplify automated browser-based testing with seamless Selenium integration, ensuring robust and reliable test execution.
Service Virtualization/NetOcean
Configuration UI Revamp
Simplified UI for easier configuration of virtualized services.Request Trace UI Revamp
Enhanced views for request-response pairs, with formatting options for headers and payloads in JSON, XML, and other formats.Messaging and Socket Service UI Revamp
Streamlined UI for creating virtualized messaging services like TIBCO, IBM MQ, and Kafka.
NetHavoc
Updated Scheduler Support
Conduct chaos experiments with diversified scheduling capabilities.Scenario Enhancements
Email notifications with scenario reports.
Import/export scenarios for seamless transitions between environments.
Modify havoc order and insert new havoc dynamically.
Monitoring Suite Updates
NetDiagnostics
Java Agent Enhancements
New Plugin Architecture for Third-Party Libraries:
A revamped plugin architecture streamlines the instrumentation of third-party libraries, offering seamless integration and improved monitoring capabilities.Thread Callout Capturing Enhancements:
Configuration updates enhance the monitoring of thread callouts, enabling deeper visibility into thread operations.IP Backend Naming Rule Enhancements:
Enhanced configurations for backend naming rules simplify the process of identifying and categorizing backend IPs.Application Havoc Enhancements:
Advanced havoc types, including Shootup, Tumble, and Shootdown for All Delay Havoc, provide robust testing scenarios for enhanced application resilience.
Golang Agent Enhancements
New application monitoring capabilities extend the agent’s functionality, improving insight into performance metrics and operational data.
DotNet Agent Updates
Enhancements to monitoring and diagnostics ensure comprehensive performance tracking for DotNet applications.
PHP Agent
Improved features optimize PHP application monitoring and provide deeper insights into performance bottlenecks.
NodeJS Agent
Enhancements to the NodeJS agent deliver more granular monitoring capabilities, ensuring seamless performance tracking.
NetVision Enhancements
Region-Wise Currency Support for Order KPIs:
Metrics related to order KPIs are now visualized in regional currencies, allowing organizations to track revenue-impacting factors more accurately.Gradle Version Support in Android SDK:
The latest Gradle version is now supported in the Android SDK for capturing Real User Monitoring (RUM) metrics. This ensures seamless automation for building, testing, and deploying Android apps while enabling improved user experience tracking and root cause analysis.Bot Detection in Production Traffic:
A bot detection feature under UX server settings identifies and filters bot traffic from production sessions, ensuring accurate data integrity and improved decision-making.
NetForest Enhancements
AWS Data Pipeline Support:
Directly ingest AWS logs into the NetForest Database (NFDB) and utilize the NetForest Query Language (NFQL) to perform in-depth analysis and uncover insights. This reduces costs while providing powerful querying capabilities for Root Cause Analysis (RCA).Custom Log Fields Creation:
Users can now define custom fields within production logs to filter and analyze data efficiently. This customization aids in quicker RCA and reduces the time it takes to detect performance issues.Custom Log Parser Support:
Leverage an extensive library of technology-based log parsers and customize them according to your logging methodologies. This enables precise correlations with traces and user sessions, reducing detection time for critical issues.
Events
Achieving exceptional digital customer experience in today’s digital-first economy
Cavisson Connect 3.0
On September 22, Cavisson hosted a virtual conference, “Ensuring Exceptional Customer Experience in Today’s Digital-First World.” Industry leaders joined us to discuss strategies for enhancing application resilience and delivering outstanding digital customer experiences. Don’t miss it!
We were honored to welcome key stakeholders and decision-makers from various industry verticals to our office. The event provided an invaluable platform for discussing how to create resilience against application failure and deliver outstanding customer experiences.
New Josh 2025
Cavisson Systems kicked off the year with vibrant energy at the New Josh 2025 celebration! The event was filled with thrilling activities, incredible music, and mesmerizing dance performances that uplifted everyone’s spirits. Here’s to an amazing year ahead!
We were honored to welcome key stakeholders and decision-makers from various industry verticals to our office. The event provided an invaluable platform for discussing how to create resilience against application failure and deliver outstanding customer experiences.