How Real User Monitoring Works
At its core, RUM tools integrate a small piece of JavaScript code into your website. This code tracks every user interaction, from page loads to clicks, providing real-time insights into the user’s journey. When a visitor lands on a page, the RUM tool begins gathering data on various metrics, including: – Page load times – Navigation paths – Interaction points (such as clicks or form submissions) – Errors encountered This data is sent to a server where it is processed and analyzed, revealing performance bottlenecks and patterns of user behavior. For example, if multiple users are experiencing slow load times or frequent crashes on a particular page, the RUM tool will flag this, allowing you to address the issue promptly. The data captured via the javascript code is then presented in the forms of reports and customizable dashboards. Business owners, developers, and marketers can use this information to optimize the site, enhance the user experience, and ultimately, improve conversion rates.Key Metrics Used in Real User Monitoring
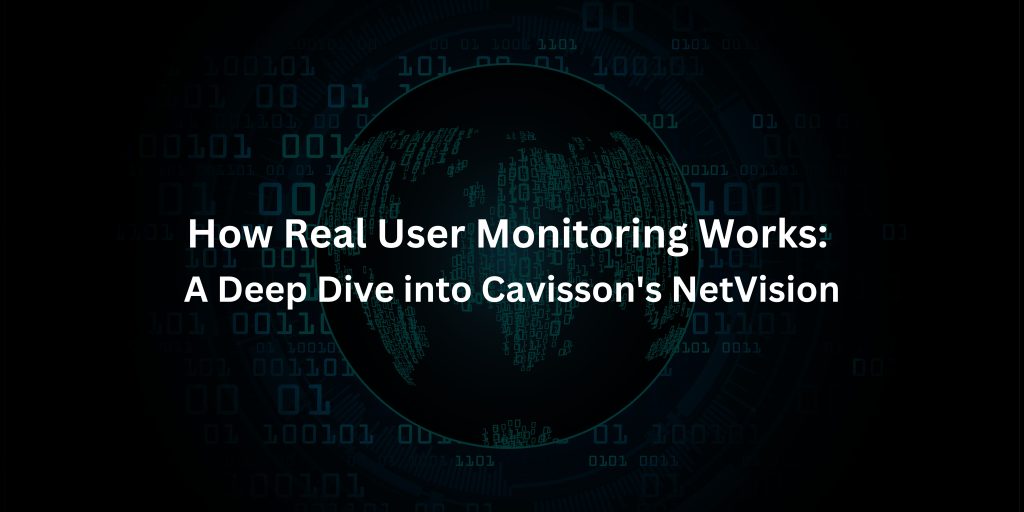
1. User Satisfaction Score (Apdex)
The Application Performance Index (Apdex) is an industry-standard measure of user satisfaction based on response times. With a score ranging from 0 to 1, Apdex classifies user experiences into three categories:
– Struggle: when users repeatedly face issues.
– Satisfied: Response times within a set threshold.
– Tolerating: Response times slightly exceeding the threshold.
– Frustrated: Response times far beyond the acceptable range.
NetVision’s Apdex metric provides a nuanced understanding of how users feel about site performance, allowing you to act before small issues escalate.
2. Page Load Time
This metric measures how long it takes for a page to fully load, from the user’s request to the final rendering of content. Page load time affects user engagement and abandonment rates. Slow-loading pages are often abandoned, leading to potential losses in revenue.
With NetVision, you can break down page load time by different elements, such as image load times or server response speeds, allowing you to make targeted improvements.
3. Bounce Rate
The bounce rate reflects the percentage of users who visit a single page before leaving without interacting. A high bounce rate can indicate user dissatisfaction or performance issues like slow page loads.
By integrating bounce rate analysis with other performance metrics, NetVision helps businesses identify and resolve the root causes of user drop-off.
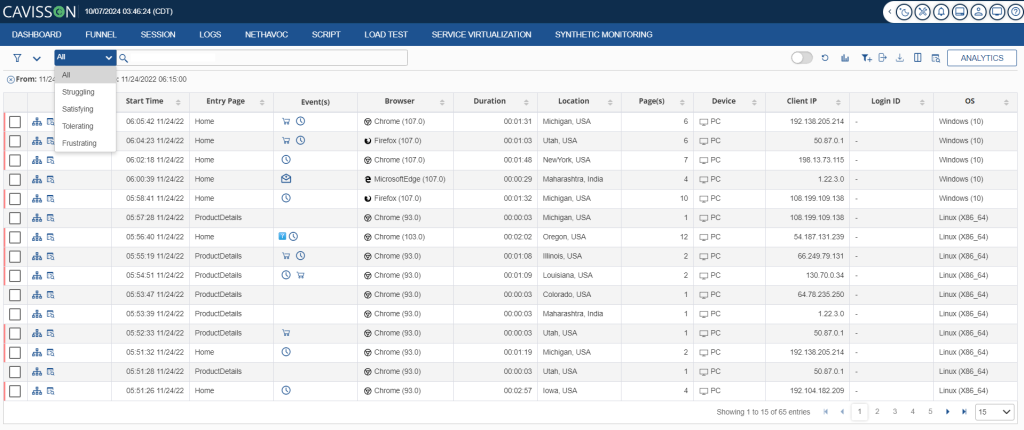
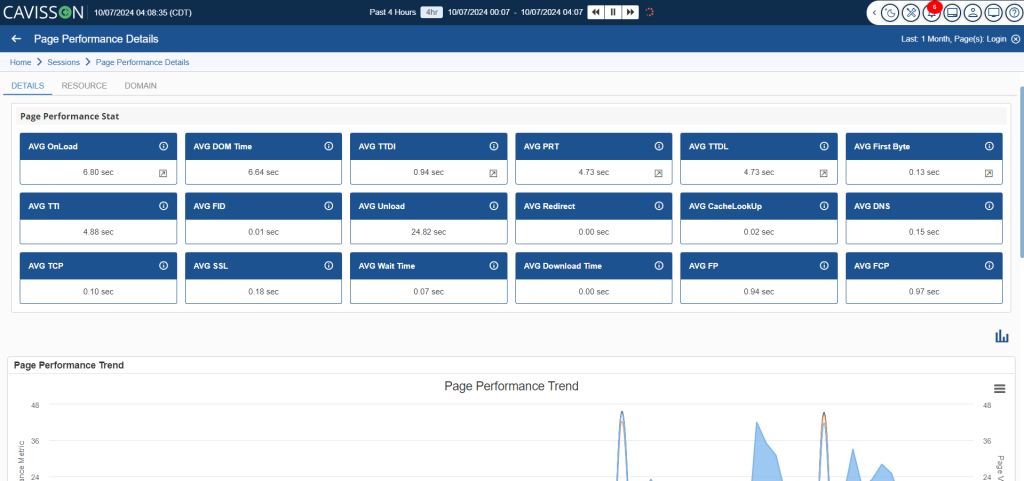
4. Page Performance Details
NetVision’s Page Performance Details offers in-depth insights into individual web page performance, tracking key metrics like page load time, Time to First Byte (TTFB), First Contentful Paint (FCP), and DOM interactive time. It breaks down performance across devices and browsers, highlights resource-specific bottlenecks, and monitors errors such as 404s or failed resource loads. This granular data enables businesses to identify and resolve issues quickly, improving user experience and ensuring smoother, faster, and more reliable page performance.
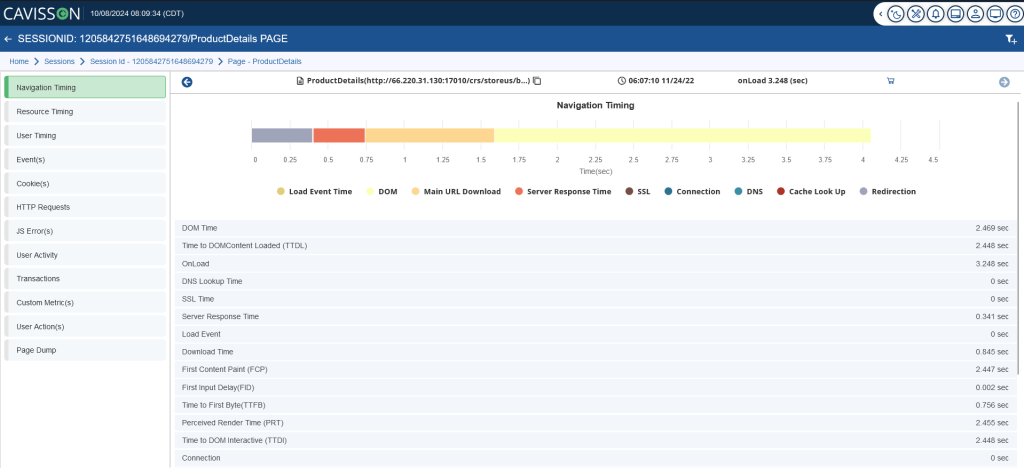
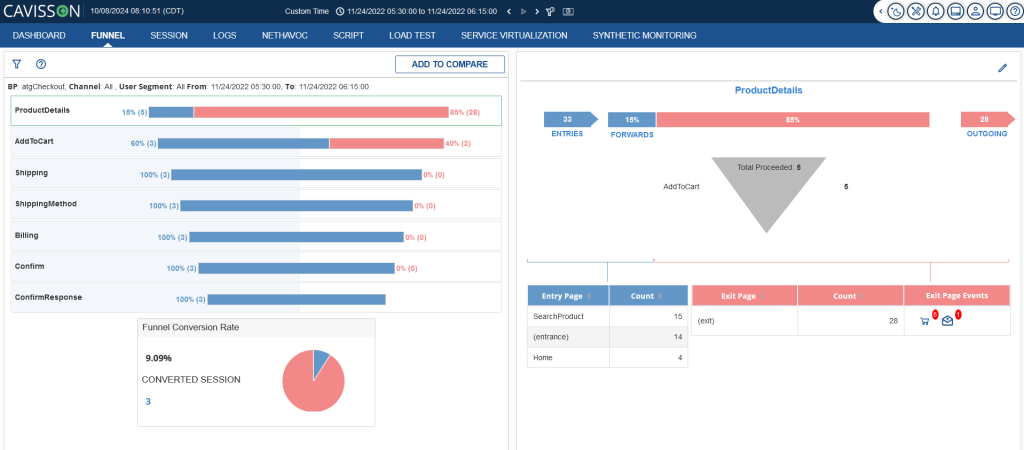
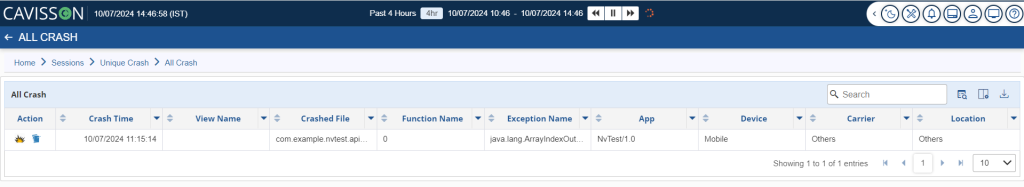
5. Crash Reports
NetVision automatically logs crash reports, enabling businesses to quickly identify and resolve critical application issues that could harm the user experience. Its Bounce Rate Analysis provides insights into pages where users exit without engaging further, helping companies focus on optimizing those areas to boost interaction. Additionally, Funnel Visualization reveals the exact points in the user journey where the most significant drop-offs occur, highlighting experience-impacting events such as slow load times or errors. By addressing these issues, businesses can make targeted improvements to reduce abandonment and increase conversions.
Why Cavisson Systems’ NetVision is Superior
While many RUM tools offer these features, Cavisson’s NetVision stands out for several reasons:
1. Real-Time Data Analytics
NetVision excels in Real-Time Data Analytics, offering unmatched visibility into user interactions and system performance as they happen. Its real-time tracking and analysis of user behavior, performance metrics, and errors enable rapid issue identification, such as high bounce rates or crashes. This allows businesses to respond proactively, minimizing user impact, enhancing digital experiences, and improving conversion rates through faster, data-driven interventions.
2. Revenue Analytics
The Revenue Analytics window helps in understanding the correlation between page performance and revenue. It helps in predicting the Revenue gain by improving the page performance. revenue analytics is also dependent on page load time.
3. Marketing Analytics
Marketing Analytics using UTM (Urchin Tracking Module) parameters allows you to track the effectiveness of your marketing campaigns by adding specific tags (UTM parameters) to your URLs. These tags provide additional information about the source, medium, campaign, and other details related to each visitor’s session.
4. Page Wise Details
Page-wise detail can analyze the page performance across multiple metrics. You can drill to any session causing a spike in the dashboard from a single page. Through page detail, the root cause for the spike can also be known as it enables you to view all the details of the session.
5. Customer Feedback
Customer feedback is a mechanism that processes incoming feedback and applies a filtering process to extract relevant and valuable information by removing irrelevant content.
6. Integration with APM, and Logs
NetVision integrates seamlessly with Cavisson’s suite of performance monitoring tools, including Application Performance Monitoring (APM). This combination provides a 360-degree view of the user experience, enabling businesses to correlate real user data with backend performance issues.
Conclusion
Real User Monitoring is essential for understanding how users interact with your website or application. With Cavisson Systems’ NetVision, businesses gain access to a highly advanced RUM tool that delivers real-time insights, detailed performance metrics, and the ability to integrate with other monitoring tools for end-to-end observability. By leveraging NetVision’s superior capabilities, businesses can provide seamless digital experiences, increase user satisfaction, and boost conversion rates. If you’re looking to take your website’s performance monitoring to the next level, Cavisson’s NetVision is the tool of choice.