IBM DB2 Monitoring
Overview
This page provides the capability for profiling IBM DB2. Cavisson machine agent establishes a connection with IBM DB2 database server. After establishing the connection with database, monitor executes some queries to capture the required stats to get the health status of IBM DB2. To make connection with IBM DB2, user needs to provide connectivity credential to the monitor program, so that it can make connection to the database.
It also provides end-to-end monitoring of IBM DB2 queries with insights into various aspects, such as Buffer Pool, I/O, Log, Connection, Cache, and Transactions.
This page provides insight into IBM DB2 monitoring capabilities of Cavisson NetDiagnostics.
Benefits
Implementing effective IBM DB2 monitoring with NetDiagnostics offers the following benefits:
- Improved application availability
- Increased database performance
- Quick detection of database outages, failures, and table corruption
Prerequisites
Below are Prerequisites:
- To make connectivity with IBM DB2, db2jcc4.jar should be present in cmon’s class-path.
- To fetch data, monitor requires DB2 host, port, database name, username, and password.
We are fetching data from below DB2 tables:
- SYSIBMADM.SNAPDB
- SYSIBMADM.MON_DB_SUMMARY
The DB2 user should have privileges of read access to SYSIBMADM Database.
IBM DB2 Metrics
Following are some key metrics that will capture the health status of DB2:
Buffer Pool Stats
| Graph Name | Data Type | Description |
|---|---|---|
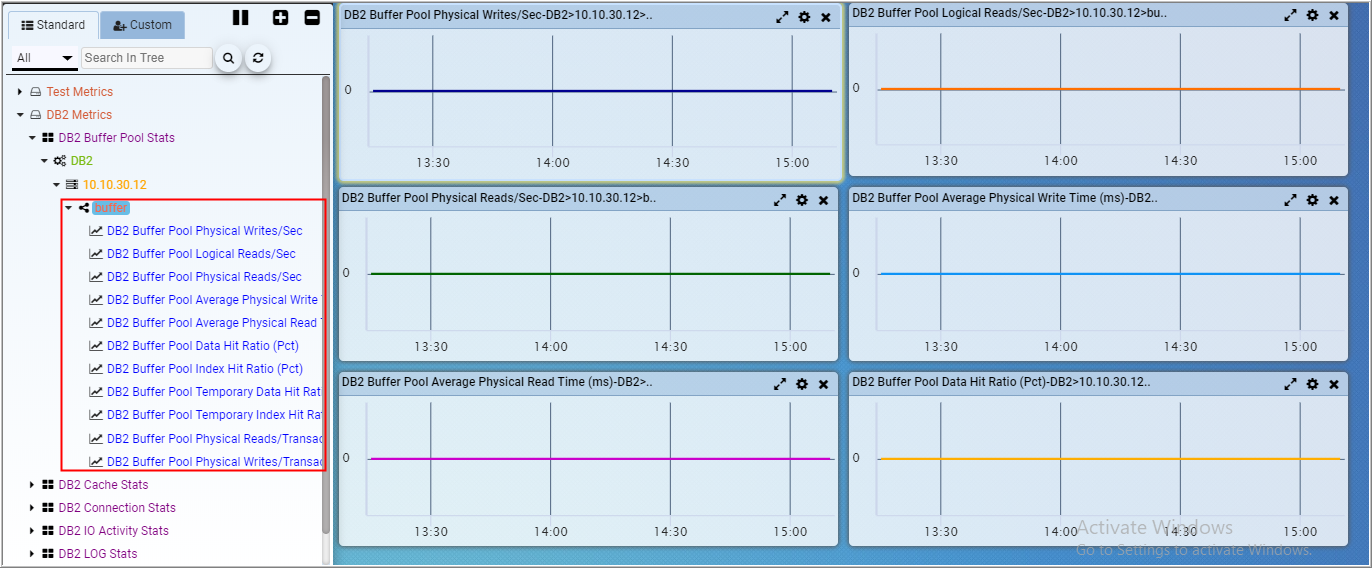
| DB2 Buffer Pool Physical Writes/Sec | Rate | Number of times a buffer pool data page was physically written to disk per second. |
| DB2 Buffer Pool Logical Reads/Sec | Rate | Number of data pages, which have been requested from the buffer pool (logical) for regular and large table spaces per second. |
| DB2 Buffer Pool Physical Reads/Sec | Rate | Number of data pages read in from the table space containers (physical) for regular and large table spaces per second. |
| DB2 Buffer Pool Average Physical Write Time (Sec) | Rate | Total amount of time spent in physically writing data or index pages from the buffer pool to disk in seconds. |
| DB2 Buffer Pool Average Physical Read Time(Sec) | Rate | Total amount of time spent reading in data and index pages from the table space containers (physical) for all types of table spaces in seconds. |
| DB2 Buffer Pool Data Hit Ratio (%) | Sample | Percentage of data pages found in the buffer pool without having to read from disk. |
| DB2 Buffer Pool Index Hit Ratio (%) | Sample | Percentage of index pages found in the buffer pool without having to read from disk. |
| DB2 Buffer Pool Temporary Data Hit Ratio (%) | Sample | Percentage of data pages found in the buffer pool without having to read from temporary table spaces. |
| DB2 Buffer Pool Temporary Index Hit Ratio(%) | Sample | Percentage of index pages found in the buffer pool without having to read from temporary table spaces. |
| Db2 Buffer pool physical Reads/Transaction | Rate | Number of data pages read in from the table space containers (physical) for regular and large table spaces per transaction. |
| Db2 Buffer Pool Physical Writes/Transaction | Rate | Number of times a buffer pool data page was physically written to disk per transaction. |
Transaction Stats
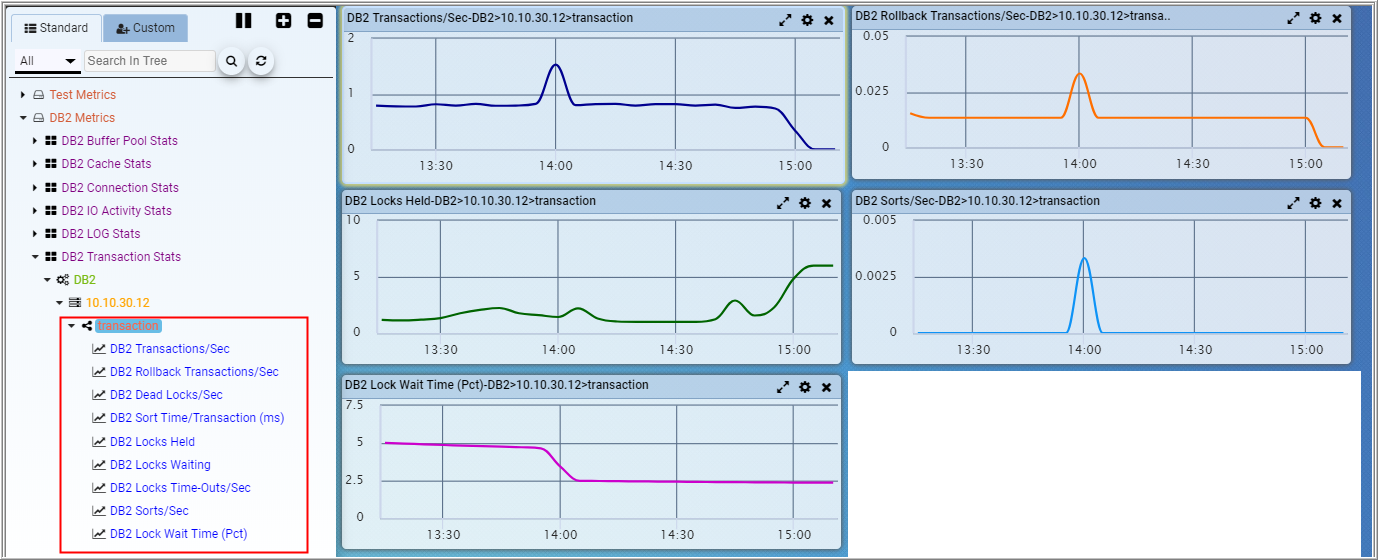
DB2 Transaction Stats provides metrics related to transaction in the database.
| Graph Name | Data Type | Description |
|---|---|---|
| DB2 Transactions/Sec | Rate | Number of transaction per second. |
| DB2 Rollback Transactions/Sec | Rate | Number of transactions roll backed per second. |
| DB2 Dead Locks/Sec | Rate | Number of deadlocks per second. |
| DB2 Sort Time/Transaction | Rate | Average Time spent in sort per transaction in seconds. |
| DB2 Locks Held | Sample | Number of locks currently held by all applications in the database. |
| DB2 Locks Waiting | Sample | Current number of agents waiting on a lock. |
| DB2 Locks Time-Outs/Sec | Rate | Number of times that a request to lock an object timed out instead of being granted per second. |
| DB2 Total Sort/Sec | Rate | Number of sorts that have been executed per second |
| DB2 Lock Wait Time (Pct) | Sample | The percentage of time spent waiting within the DB2 database server that was spent waiting on locks. |
I/O Activity Stats
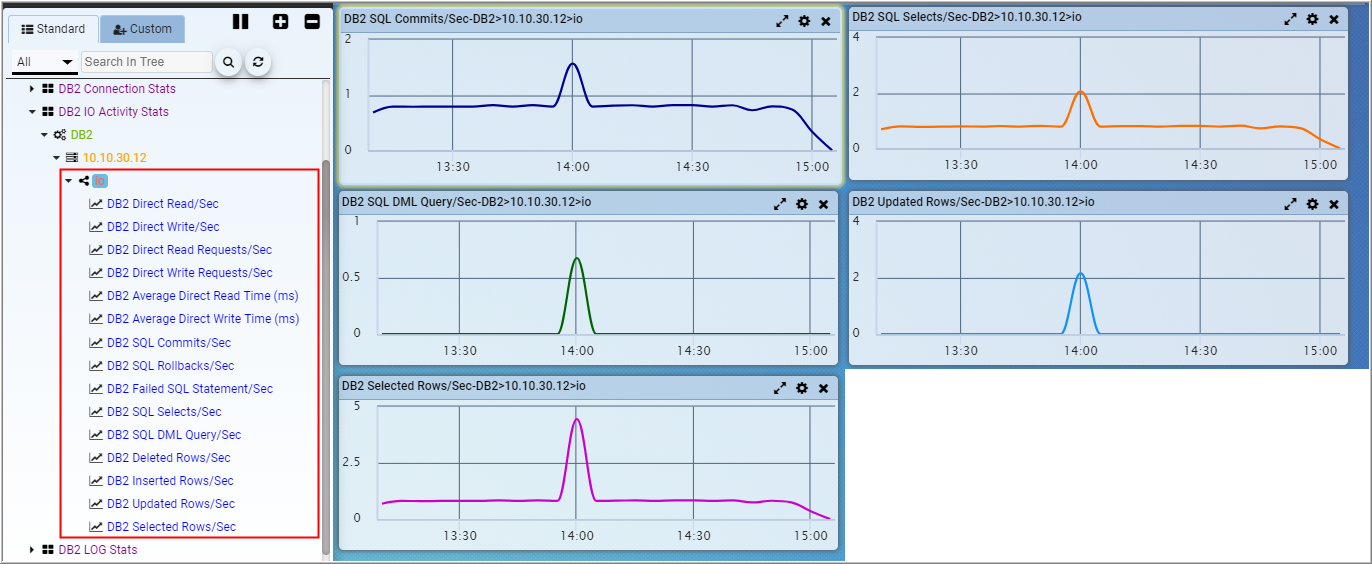
DB2 IO Activity Stats provide metrics related to Input/Output activity in the database.
| Graph Name | Data Type | Description |
|---|---|---|
| DB2 Direct Read/Sec | Rate | Number of read operations from direct read instead of buffer pool. |
| DB2 Direct Write/Sec | Rate | Number of write operations from direct write instead of buffer pool. |
| DB2 Direct Read Requests/Sec | Rate | Number of requests to perform a direct read of one or more sectors of data. |
| DB2 Direct Write Requests/Sec | Rate | Number of requests to perform a direct write of one or more sectors of data. |
| DB2 Average Direct Read Time (Sec) | Rate | Average time spent to perform direct read operation in seconds. |
| DB2 Average Direct Write Time (Sec) | Rate | Average time spent to perform direct write operation in seconds. |
| DB2 SQL Commits/Sec | Rate | Number of SQL COMMIT statements that have been attempted per second. |
| DB2 SQL Rollbacks/Sec | Rate | Number of SQL ROLLBACK statements that have been attempted per second. |
| DB2 Failed SQL Statement/Sec | Rate | Number of failed SQL statements per second. |
| DB2 SQL Selects/Sec | Rate | Number of SQL SELECT statements per second. |
| DB2 Deleted Rows/Sec | Rate | Number of rows deleted per second. |
| DB2 Inserted Rows/Sec | Rate | Number of rows inserted per second. |
| DB2 Updated Rows/Sec | Rate | Number of rows updated per second. |
| DB2 Selected Rows/Sec | Rate | Number of rows selected per second. |
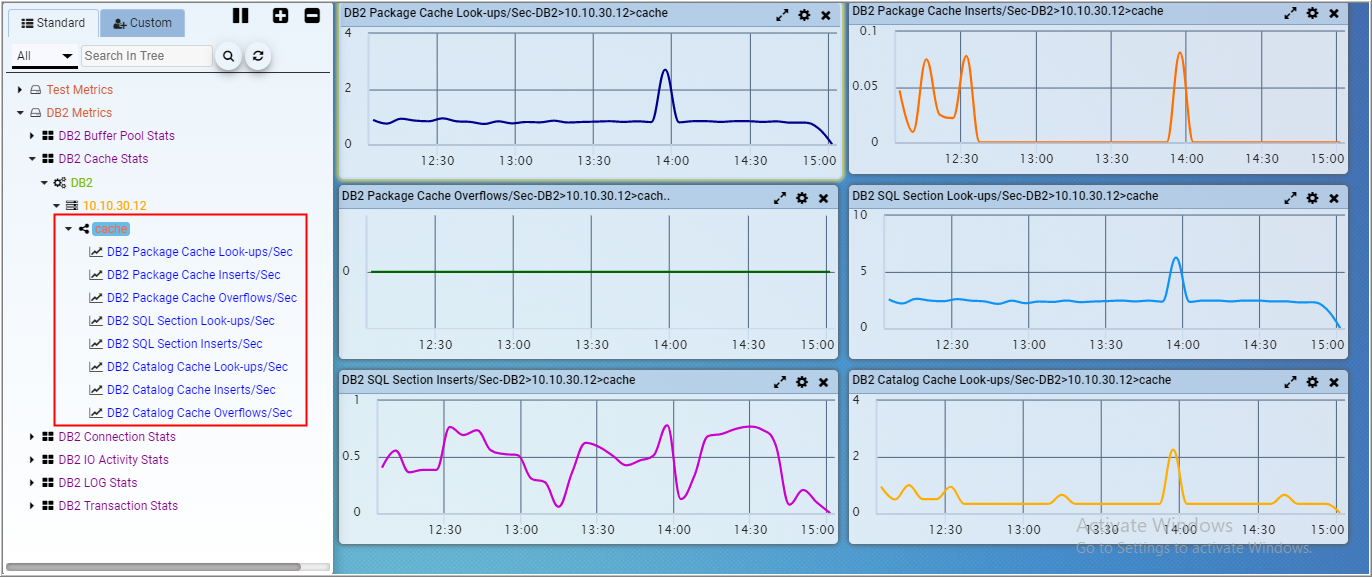
Cache Stats
DB2 Cache Stats provide metrics related to database cache.
| Graph Name | Data Type | Description |
|---|---|---|
| DB2 Package Cache Look-ups/Sec | Rate | Number of times that an application looked for a section or package in the package cache per second. |
| DB2 Package Cache Inserts/Sec | Rate | Number of times that a requested section was not available for use and had to be loaded into the package cache per second. |
| DB2 Package Cache Overflows/Sec | Rate | Number of times that the package cache overflowed the bounds of its allocated memory per second. |
| DB2 SQL Section Look-ups/Sec | Rate | Number of look-ups of SQL sections by an application from its shared SQL work space per second. |
| DB2 SQL Section Inserts/Sec | Rate | Number of inserts of SQL sections by an application from its shared SQL work space per second. |
| DB2 Catalog Cache Look-ups/Sec | Rate | Number of times that the catalog cache was referenced to obtain table descriptor information or authorization information per second. |
| DB2 Catalog Cache Inserts/Sec | Rate | Number of times that the system tried to insert table descriptor or authorization information into the catalog cache per second. |
| DB2 Catalog Cache Overflows/Sec | Rate | Number of times that the catalog cache overflowed the bounds of its allocated memory per second. |
Log Stats
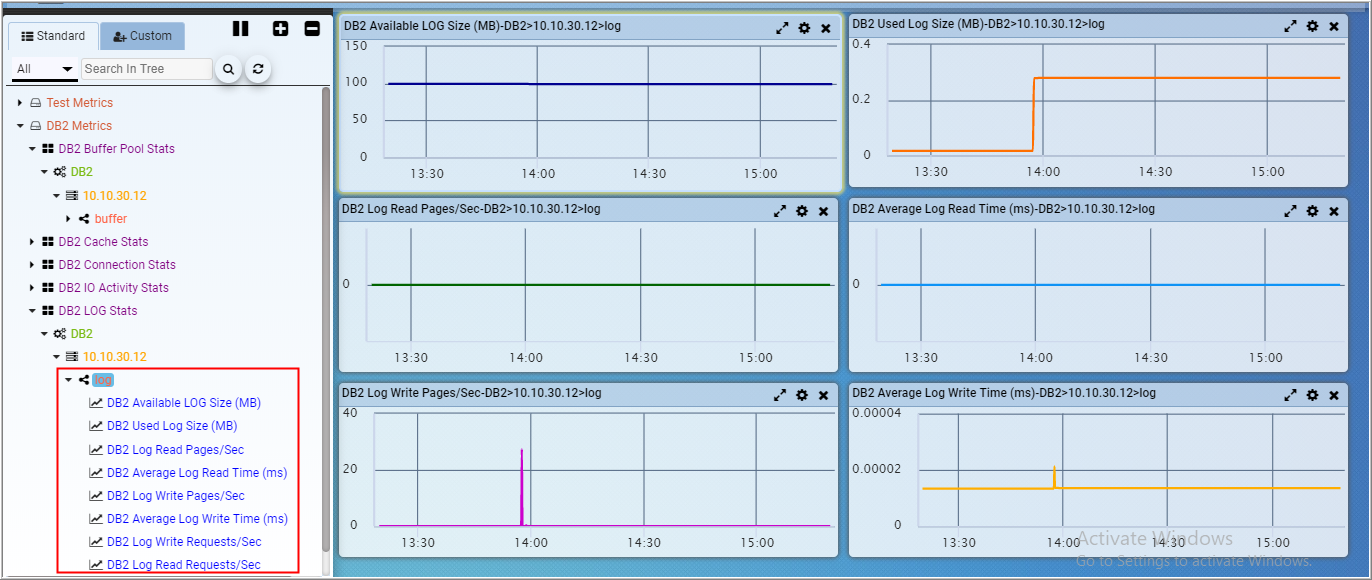
DB2 DB2 Log Stats provides metrics related to logging activities in the database.
| Graph Name | Data Type | Description |
|---|---|---|
| DB2 Available LOG Size (KB) | Sample | Amount of active log space in the database that is not being used by uncommitted transactions in Kilobytes. |
| DB2 User Log Size (KB) | Sample | Amount of active log space currently used in the database in Kilobytes. |
| DB2 Log Read Pages/Sec | Rate | Number of log pages read from disk by the logger per second. |
| DB2 Average Log Read Time (Sec) | Rate | Average time spent to read log page in seconds. |
| DB2 Log Write Pages/Sec | Rate | Number of log pages write from disk by the logger per second. |
| DB2 Average Log Write Time (Sec) | Rate | Average time spent to write log page in seconds. |
| DB2 Log Write Requests/Sec | Rate | Number of I/O requests issued by the logger for writing log data to the disk per second. |
| DB2 Log Read Requests/Sec | Rate | Number of I/O requests issued by the logger for reading log data to the disk per second. |
Connection Stats
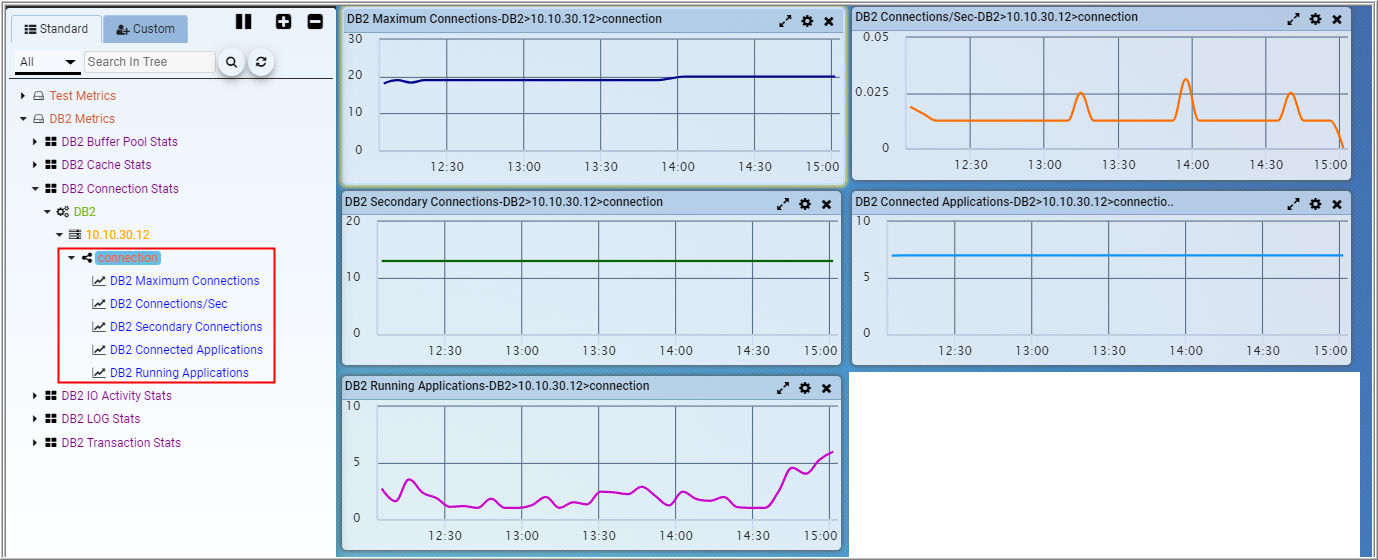
DB2 Connection Stats metrics provides database connection statistics.
| Graph Name | Data Type | Description |
|---|---|---|
| DB2 Maximum Connections | Sample | The highest number of simultaneous connections to the database since the database was activated. |
| DB2 Total Connections | Sample | Number of connections to the database since the first connect, activate, or last reset (coordinator agents). |
| Secondary Connections | Sample | Number of connections made by a sub agent to the database at the node. |
| DB2 Connected Applications | Sample | Number of applications that are currently connected to the database. |
| DB2 Running Applications | Sample | Number of applications that are currently connected to the database, and for which the database manager is currently processing a request. |
