Redis Monitoring
Overview
Redis is a popular in-memory key / value data store. Known for its performance and simple onboarding, Redis has found uses across industries and use cases, including as a:
- Database: As an alternative to a traditional disk-based database, Redis trades durability for speed, though asynchronous disk persistence is available. Redis offers a rich set of data primitives and an unusually extensive list of commands.
- Message queue: Redis’s blocking list commands and low latency make it a good backend for a message broker service.
- Memory cache: Configurable key eviction policies, including the popular Least Recently Used policy, make Redis a great choice as a cache server. Unlike a traditional cache, Redis also allows persistence to disk to improve reliability.
Graph Description
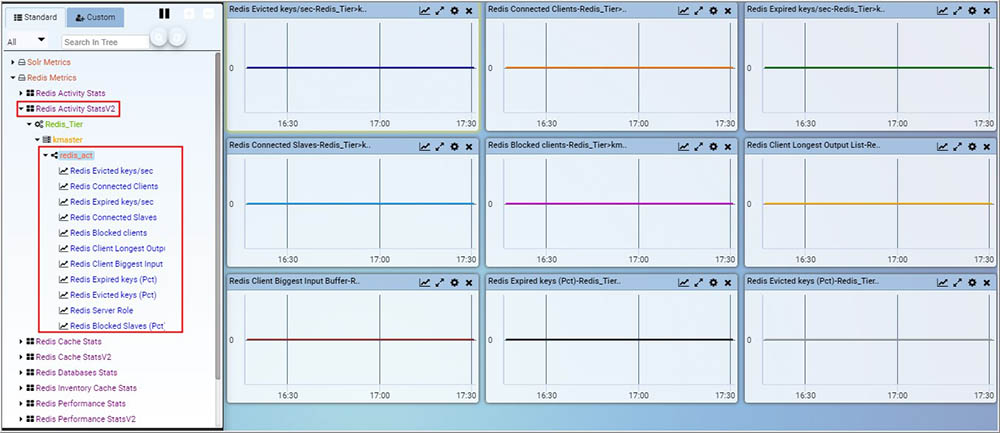
RedisActivityStatsV2
Redis server Activity stats monitor measure health of redis server. It provides metrics related to evicted keys, expired keys, connected slaves, block clients.
| Metric | Metric Description |
|---|---|
| Redis Evicted keys/sec | Number of keys removed due to reaching the max memory limit. |
| Redis Connected Clients | Number of clients connected to Redis. |
| Redis Expired keys/sec | Total number of key expiration events per second. |
| Redis Connected Slaves | Number of slaves connected to current master instance. |
| Redis Blocked clients | Number of clients pending on a blocking call. |
| Redis Client Longest Output List | Longest output list among current client connections. |
| Redis Client Biggest Input Buffer | Biggest input buffer among current client connections. |
| Redis Expired keys (Pct) | Expired keys in percentage with respect to total keys in databases. |
| Redis Evicted keys (Pct) | Evicted keys in percentage with respect to newly added keys in databases. |
| Redis Server Role | Redis server role state. Role is 1 = Master,0 = Slave. |
| Redis Blocked Slaves (Pct) | Blocked slave in percentage with respect to total slaves. |
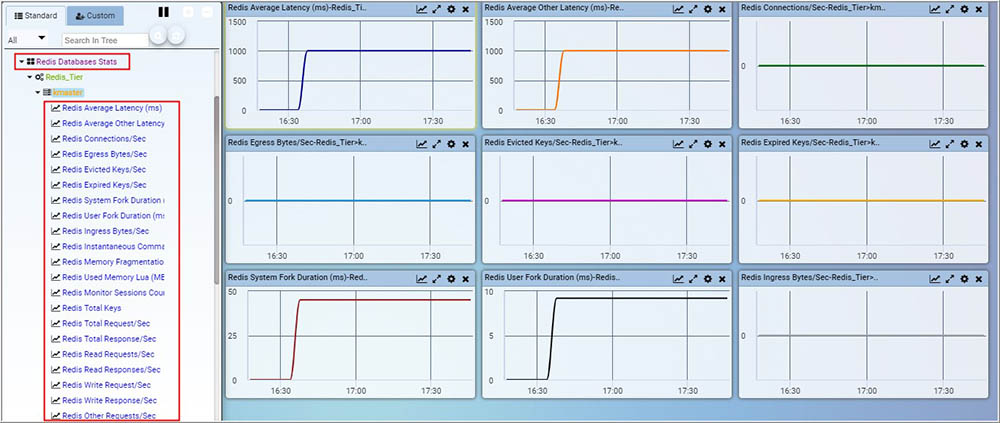
RedisBDBSStats
Redis server Databases stats provides metrics related to Average Latency, Egress Bytes, Ingress Bytes, Memory Fragmentation Ratio, Memory Size Lua, Total Request, Total Response and Used Memory etc.
| Metric | Metric Description |
|---|---|
| Redis Average Latency (ms) | Latency per read and write operation in milliseconds. |
| Redis Average Other Latency (ms) | Latency per other commands in milliseconds. |
| Redis Connections/Sec | Number of connections to the end point per second. |
| Redis Egress Bytes/Sec | Bytes leaving the router/switch via the egress interface per second. |
| Redis Evicted Keys/Sec | Number of evicted keys due to max memory limit. |
| Redis Expired Keys/Sec | Number of expired keys per sec. An expired keys is an object with expired TTL that was deleted from the database. |
| Redis System Fork Duration (ms) | Duration of the System fork operation in milliseconds. |
| Redis User Fork Duration (ms) | Duration of the user fork operation in milliseconds. |
| Redis Ingress Bytes/Sec | Bytes coming into the router/switch via the ingress interface per second. |
| Redis Instantaneous Commands/Sec | Number of commands processed per second. |
| Redis Memory Fragmentation Ratio | The ratio between the memory allocated by Redis and the memory as seen by the operating system. |
| Redis Used Memory Lua (MB) | Used memory in megabytes by the Lua engine. |
| Redis Monitor Sessions Count | Number of monitor sessions. |
| Redis Total Keys | The total number of keys in the database. |
| Redis Total Request/Sec | Total number of request received by the redis server per second. |
| Redis Total Response/Sec | Total number of response delivered by the redis server per second. |
| Redis Read Requests/Sec | The number of read requests per second. |
| Redis Read Responses/Sec | The number of read responses per second. |
| Redis Write Request/Sec | Number of write request per second. |
| Redis Write Response/Sec | Number of write response per second. |
| Redis Other Requests/Sec | Number of other requests per second. |
| Redis Other Responses/Sec | Number of other responses per second. |
| Redis Read Hits/Sec | The number of read operations successfully per second. |
| Redis Read Misses/Sec | The number of read operations failed per second. |
| Redis Write Hits/Sec | The number of write operations per second. |
| Redis Write Misses/Sec | The number of write operations failed per second. |
| Redis Pubsub Channels | Global number of pub/sub channels with client subscriptions. |
| Redis Pubsub Patterns | Global number of pub/sub pattern with client subscriptions. |
| Redis Shard CPU System (Pct) | System CPU utilization by the redis shard. |
| Redis Shard CPU User (Pct) | User CPU Utilization by the Redis shard. |
| Redis Total Connections Received/Sec | Total number of connections received by the server per second. |
| Redis Used Memory (MB) | Total number of Megabytes allocated by Redis. |
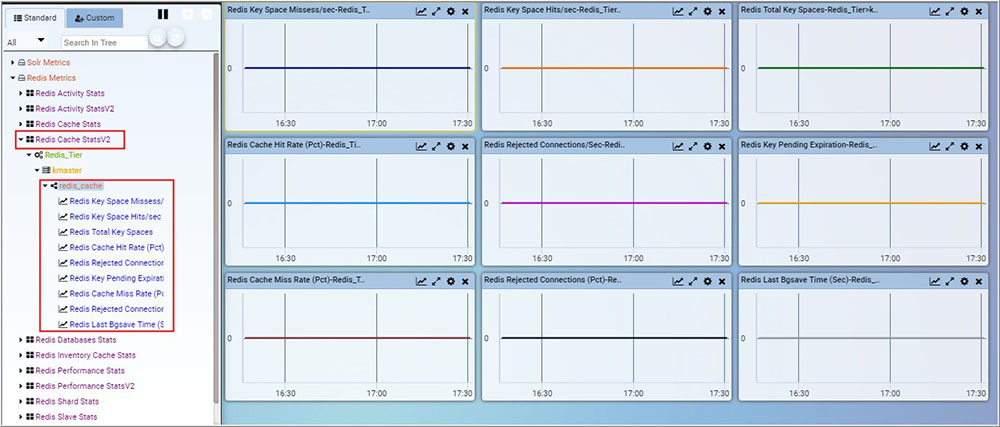
RedisCacheStatsV2
Redis server cache stats monitor measure health of redis server cache. It provides metrics related to cache keyspace hits, keyspace miss, keyspace pending expiration etc.
| Metric | Metric Description |
|---|---|
| Redis Key Space Missess/sec | Number of attempts to find keys in redis database which do not exist. |
| Redis Key Space Hits/sec | Number of attempts to find keys in redis database which do exist. |
| Redis Total Key Spaces | Total number of key in all database. |
| Redis Cache Hit Rate (Pct) | Cache hit ratio is the percentage of successful reads out of all read operations in redis database. |
| Redis Rejected Connections/Sec | Number of connection disconnected per seconds as Redis instance is currently at its maximum number of connections. |
| Redis Key Pending Expiration | Total number of key expiration events pending in all database. |
| Redis Cache Miss Rate (Pct) | Cache miss ratio is the percentage of failure reads out of all read operations in redis database. |
| Redis Rejected Connections (Pct) | Rejected connections in percentage due to max connection limit is reached. |
| Redis Last Bgsave Time (Sec) | Duration of the last RDB save operation in seconds. |
RedisDatabaseStats
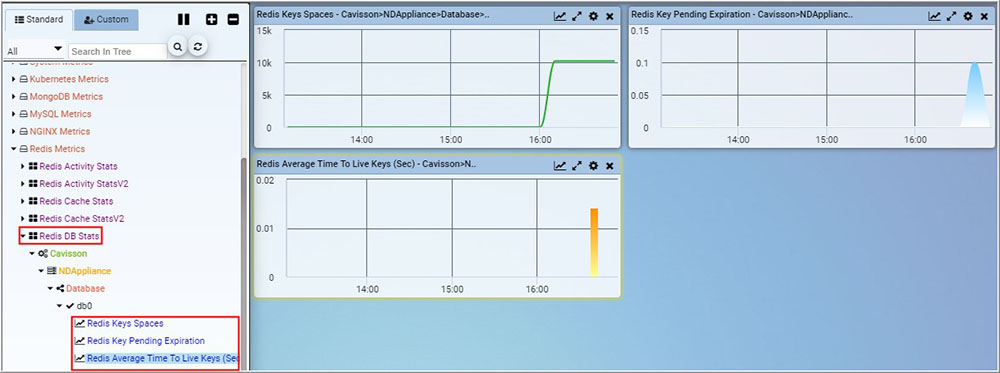
Redis server DB stats provides metrics related to total keys, keyspace pending expirations, average time to live.
| Metric | Metric Description |
|---|---|
| Redis Keys Spaces | Total number of key in database. |
| Redis Key Pending Expiration | Number of key expiration events. |
| Redis Average Time To Live Keys (Sec) | Average time in seconds to life of keys with an expiration set. |
RedisInventoryCache
| Metric | Metric Description |
|---|---|
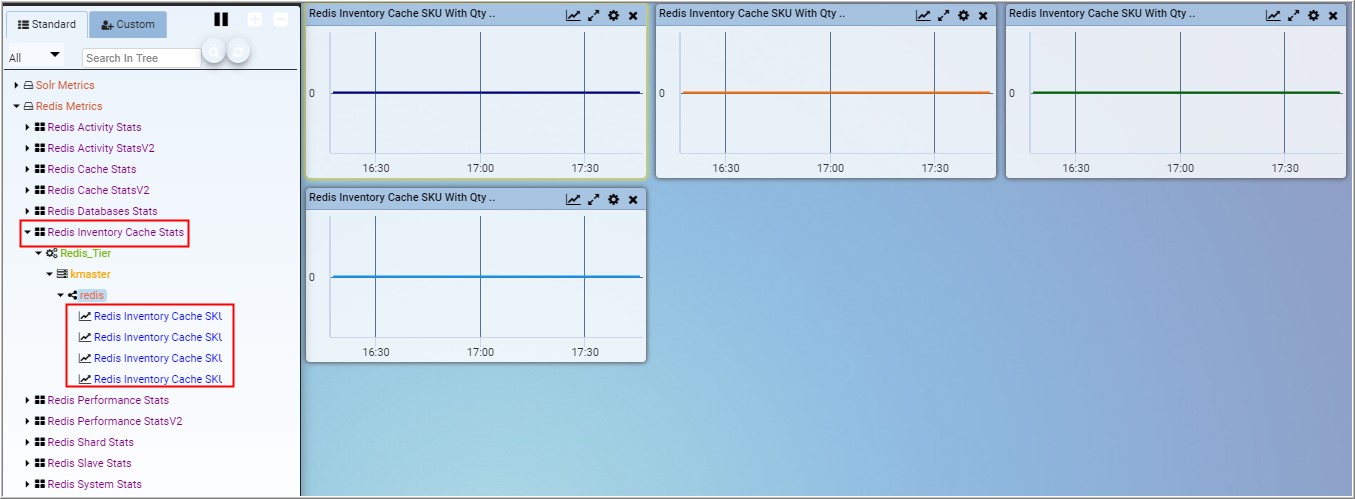
| Redis Inventory Cache SKU With Qty Zero | Number of SKU’s with zero available inventory. |
| Redis Inventory Cache SKU With Qty 1-100 | Number of SKU’s with available inventory in range from 1 to 100. |
| Redis Inventory Cache SKU With Qty 101-1000 | Number of SKU’s with available inventory in range from 101 to 1000. |
| Redis Inventory Cache SKU With Qty More Than 1000 | Number of SKU’s with available inventory above 1000. |
RedisLatencyV2
| Metric | Metric Description |
|---|---|
| Time taken to serve one request (msec) | Time taken to serve one request in milliseconds. |
RedisReplicationStats
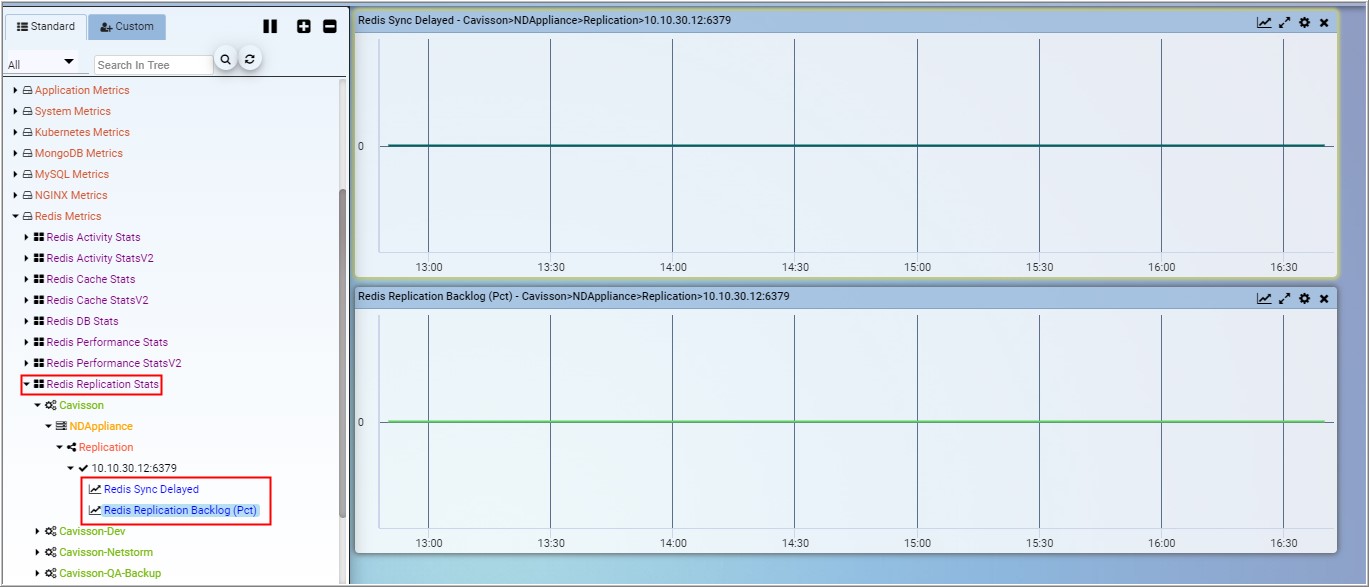
Redis server Replication stats monitor measure health of redis server. It provides metrics related to sync delayed and replay backlog.
| Metric | Metric Description |
|---|---|
| Redis Sync Delayed | Redis sync delayed state. SyncDelay is 1= delay in syncing master to slave, 0 = no delay. |
| Redis Replication Backlog (Pct) | Replication BackLog in percentage with respect to master replication backlog. |
RedisShardsStats
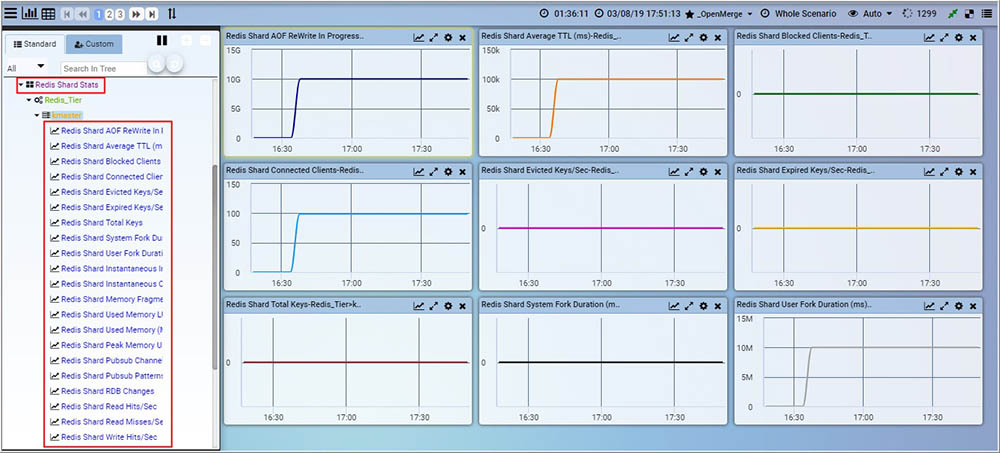
Redis server shard stats provides metrics related to Average TTL, Memory Fragmentation Ratio, Used Memory Lua, Resync Requests, Total Request, Total I/O Bytes and Used Memory etc.
| Metric | Metric Description |
|---|---|
| Redis Shard AOF ReWrite In Progress | Flag indicating a AOF rewrite operations is ongoing. If flag is off then set it’s value 0 and set it’s value 1 for on flag. |
| Redis Shard Average TTL (ms) | The average TTL(time to live) is calculated as an approximated keys with an expiration set. |
| Redis Shard Blocked Clients | Number of clients blocked by Redis. |
| Redis Shard Connected Clients | Number of clients connected to Redis. |
| Redis Shard Evicted Keys/Sec | Number of objects evicted from the database per second. |
| Redis Shard Expired Keys/Sec | Number of expired objects per sec. An expired object is an object with expired TTL that was deleted from the database. |
| Redis Shard Total Keys | The total number of keys stored in databases. |
| Redis Shard System Fork Duration (ms) | Duration of the System fork operation in milliseconds. |
| Redis Shard User Fork Duration (ms) | Duration of the User fork operation in milliseconds. |
| Redis Shard Instantaneous Input (kbps) | The network’s read rate per second in kilobits per second. |
| Redis Shard Instantaneous Output (kbps) | The network’s write rate per second in kilobits per second. |
| Redis Shard Memory Fragmentation Ratio | The ratio between the memory allocated by redis and the memory as seen by the operating system. |
| Redis Shard Used Memory LUA (MB) | Used memory in megabytes by the Lua engine. |
| Redis Shard Used Memory (MB) | Total number of Megabytes allocated by redis. |
| Redis Shard Peak Memory Used (MB) | Peak memory consumed by Redis in megabytes. |
| Redis Shard Pubsub Channels | Global number of pub/sub channels with client subscriptions. |
| Redis Shard Pubsub Patterns | Global number of pub/sub pattern with client subscriptions. |
| Redis Shard RDB Changes | Number of changes since the last dump. |
| Redis Shard Read Hits/Sec | The number of read operations successfully per second. |
| Redis Shard Read Misses/Sec | The number of read operations failed per second. |
| Redis Shard Write Hits/Sec | The number of write operations successfully per second. |
| Redis Shard Write Misses/Sec | The number of write failed per second. |
| Redis Shard System CPU (Pct) | System CPU utilization by the Redis shard. |
| Redis Shard User CPU (Pct) | User CPU utilization by the Redis shard. |
| Redis Shard Full Synchronizations | Number of times slaves have fully synchronized with master. |
| Redis Shard Partial Error Synchronizations | Number of times partial synchronization have failed to complete. |
| Redis Shard Partial OK Synchronizations | Number of times partial synchronization have completed. |
| Redis Shard Total Requests | Total number of requests received by the redis server. |
RedisSlaveStats
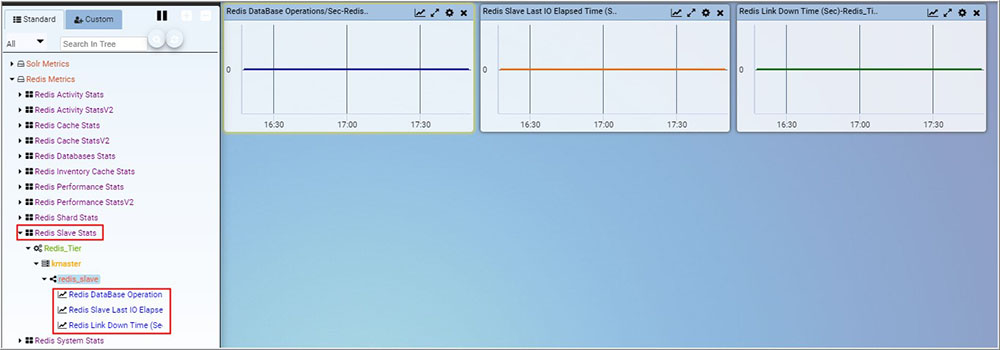
Redis Slave stats monitor measure health of redis slaves nodes. It provides metrics related to logging system RDB, master-slave communication.
| Metric | Metric Description |
|---|---|
| Redis DataBase Operations/Sec | Number of changes to the database per second since last dump operation to database |
| Redis Slave Last IO Elapsed Time (Sec) | Time in seconds since last interaction between slave and master. |
| Redis Link Down Time (Sec) | Time in seconds of the link between master and slave being down. |
RedisSystemStats
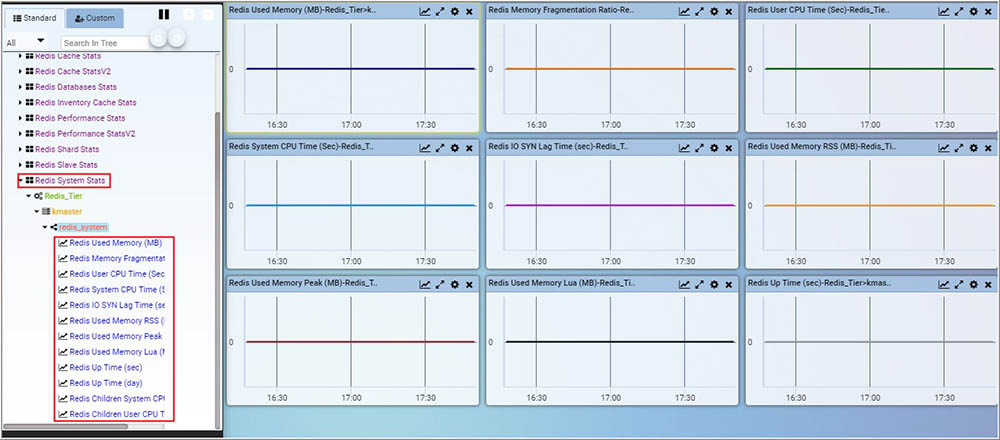
Redis server system stats monitor measure health of redis server. It provides metrics related to used Memory, user cpu time, system cpu time, IO SYN Lag Time.
| Metric | Metric Description |
|---|---|
| Redis Used Memory (MB) | Total number of Megabytes allocated by Redis. |
| Redis Memory Fragmentation Ratio | Ratio of memory used by the operating system to memory allocated by Redis. |
| Redis User CPU Time (Sec) | User CPU consumed by Redis server. |
| Redis System CPU Time (Sec) | System CPU consumed by the Redis server. |
| Redis IO SYN Lag Time (sec) | Number of seconds since last transfer I/O during a SYNC operation. |
| Redis Used Memory RSS (MB) | Redis allocated memory in megabytes as seen by the operating system. |
| Redis Used Memory Peak (MB) | Peak memory consumed by Redis in megabytes. |
| Redis Used Memory Lua (MB) | Used memory in megabytes by the Lua engine. |
| Redis Up Time (sec) | Number of seconds since Redis server started. |
| Redis Up Time (day) | Number of days since Redis server started. |
| Redis Children System CPU Time (Sec) | System CPU consumed by the background processes. |
| Redis Children User CPU Time (Sec) | User CPU consumed by the background processes. |
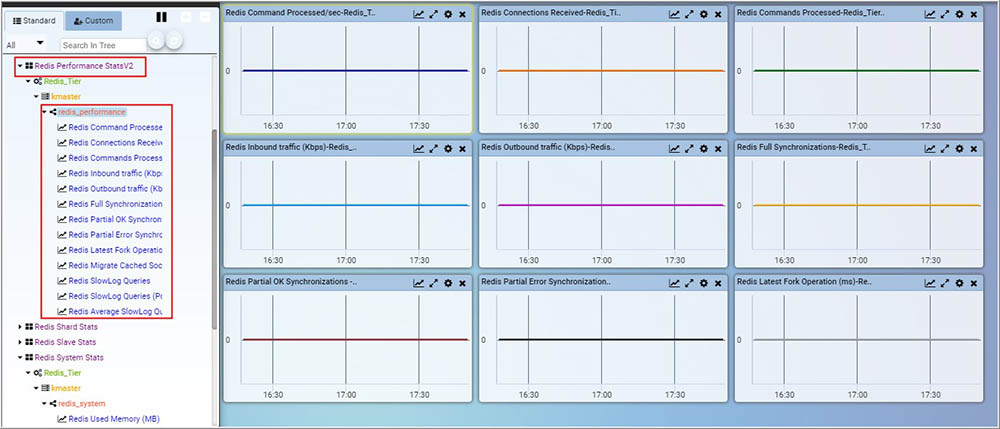
RedisperformanceStatsV2
Redis server Performance stats monitor measure health of redis server. It provides metrics related to latency, command/sec, connection received, total command processed.
| Metric | Metric Description |
|---|---|
| Redis Command Processed/sec | Number of operations processed by the database within a given period of interval. |
| Redis Connections Received | Total number of connections accepted by the server. |
| Redis Commands Processed | Total number of commands processed by the server. |
| Redis Inbound traffic (Kbps) | Total inbound traffic in kilobits per second |
| Redis Outbound traffic (Kbps) | Total outbound traffic in kilobits per second |
| Redis Full Synchronizations | Number of times slaves have fully synchronized with master. |
| Redis Partial OK Synchronizations | Count of the number of times partial syncs have completed. |
| Redis Partial Error Synchronizations | Count of the number of times partial syncs have failed to complete. |
| Redis Latest Fork Operation (ms) | Duration of the latest fork operation in milliseconds. |
| Redis Migrate Cached Sockets | Number of migrate cached sockets. |
| Redis SlowLog Queries | Number of slowlog queries. |
| Redis SlowLog Queries (Pct) | Slowlog query in percentage with respect to total query. |
| Redis Average SlowLog Query time (mus) | Average slow log query time in microseconds |
