SNMP Device Monitoring
Overview
Cavisson’s SNMP based performance monitoring is designed to give you visibility into your network-connected devices, such as routers, switches, servers, and firewalls using SNMP.

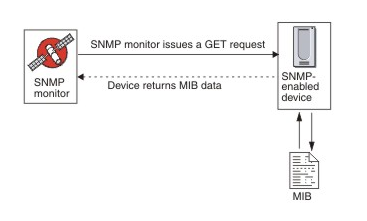
The Cavisson agent collects SNMP data from network devices by polling OIDs, and submitting the responses as metrics. These metrics are then available for visualization, correlation, and alerting across the Cavisson platform so you can easily trace the root cause of the issue. Configure the Agent to collect metrics such as bandwidth utilization, throughput, and up/down of devices.
SNMP Compliant Devices
Since Cavisson uses its generic SNMP monitoring capabilities, it opens up a plethora of options to monitor devices that are from different vendors. Some of the most widely used devices across the industry are compatible with our suite of products and are mentioned below:
SNMP ROUTERS
Some of the most commonly used routers that support SNMP are –
- Cisco RV34x Series Router
- D-Link DXS 3600 Series-D View 7 Router
- Juniper RFC 1215
- HP 6600 Series Routers
- Nokia 7750 Series Router
- Huawei AR Series Router
- Avaya 1000 & 3000 Series Router
- Arista 7000R Series Router
- TP-LINK 11N AP Router
SNMP SWITCHES
Switches that support SNMP are –
- Dell N Series Switches
- HP 5830 Series Switches
- Cisco Catalyst 2960 Series Switches
- D-Link DES-1228- WEB Smart Switch
- Nokia 7450 Series Switch
- Huawei S Series Switch
- Avaya 4000 & 5000 Series Switch
- Arista 7000X Series Switch
- TP-Link 1500 1600 1700 2500 2600 Series Switch
SNMP FIREWALL
- Cisco ASA 5500-X Series Firewalls
- Huawei USG Series Firewalls
- Sophos XG Firewalls
- Fortinet FortiGate Firewalls
- SonicWall NSA & TZ Series Firewalls
SNMP LOAD BALANCER
- Barracuda Load Balancer
- HAProxy ALOHA Load Balancer
- Citrix ADC Load Balancer
By no means are we limited to the aforementioned list. You can monitor any SNMP compliant device with our generic SNMP monitoring solution and harness the power of the insights you will get to quickly identify the root cause.
Metrics You Can Monitor With Our SNMP Solution
| Network Delay | Capacity |
| Packet Loss (Pct) | Capacity / Behavior |
| Operational Status | Capacity |
| Transmited packet Discarded | Capacity |
| Recieved packet Discarded | Capacity |
| Transmited packet Errors | Capacity |
| Recieved packet Errors | Capacity |
| CPU Utilization (Pct) of POS | Capacity |
| CPU Utilization (Pct) of corporate office switches | Capacity |
Visualize your SNMP Device Data
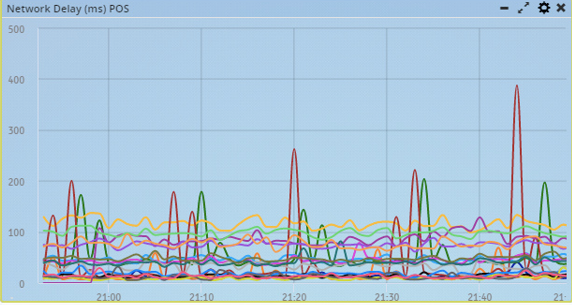
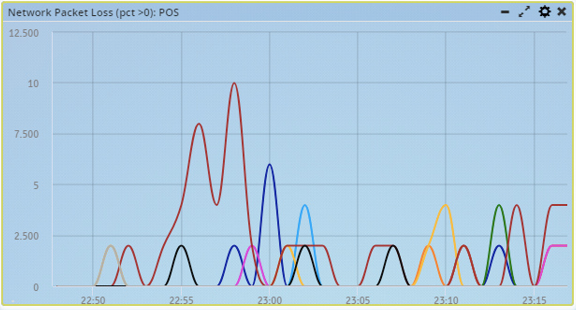
Make immediate sense of a multitude of network data via our dashboards and visualizations to quickly spot anomalies for your devices. Below are some examples of visualizations rendered on the back of SNMP data:


Conclusion
Using Cavisson, you can not only monitor SNMP device compliant data but also correlate it, visualize it, build alerts on it to derive value from your devices as never seen before. With our End to End monitoring solution suite, you will never miss a pulse of your networking devices’ health.

